
Need help implementing, managing, understanding, or creating dashboards for website traffic data from Google Analytics? I have 13 years experience with Google Analytics, Google Tag Manager, and Google’s Looker Studio. Email me with questions or freelance opportunities. 🙂 mikeeschmee at gmail
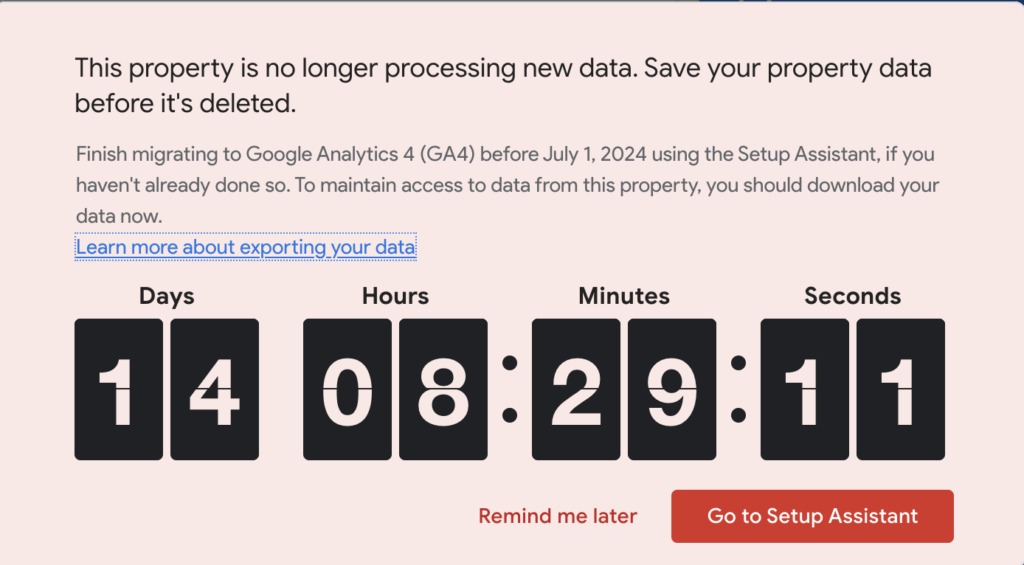
Google Analytics says they will be deleting all old reporting for the free users on the Legacy Google Analytics starting July 1st, 2024! If you want to have any of this data for reference, archives, etc. there is a semi-easy way to export this data to Excel files/Google Sheets. These can be basic traffic by month for the last ten years, or hyper specific with multiple dimentions/metrics invovled.
See the 6 easy steps below!
Reference documentation: https://developers.google.com/analytics/solutions/google-analytics-spreadsheet-add-on
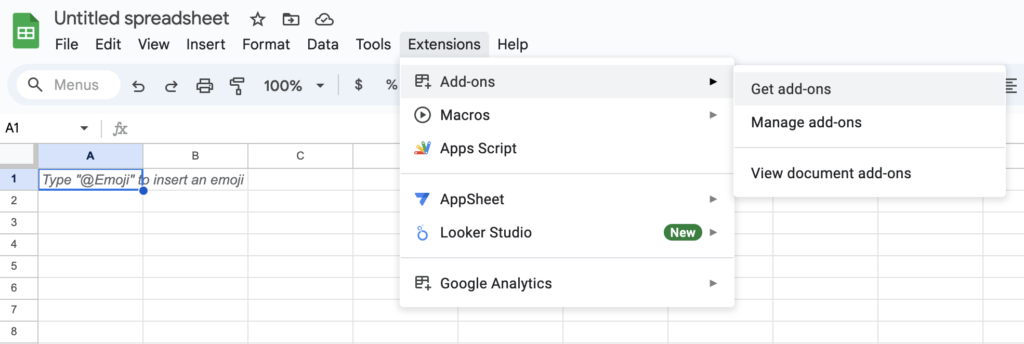
Step 1: Open up Sheets, and Add the Extension to your workbook. Go to Extensions>Add-ons>Get add-ons. Once that opens, search “google” and install the add-on called “Google Analytics”.
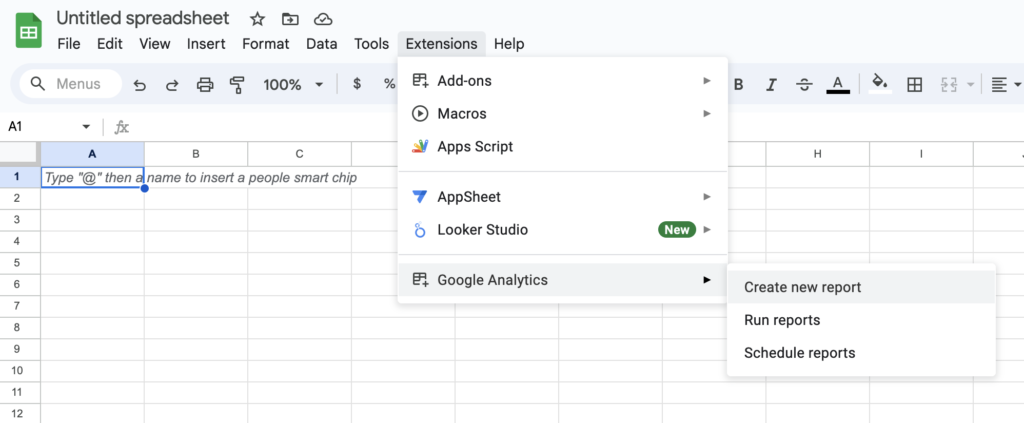
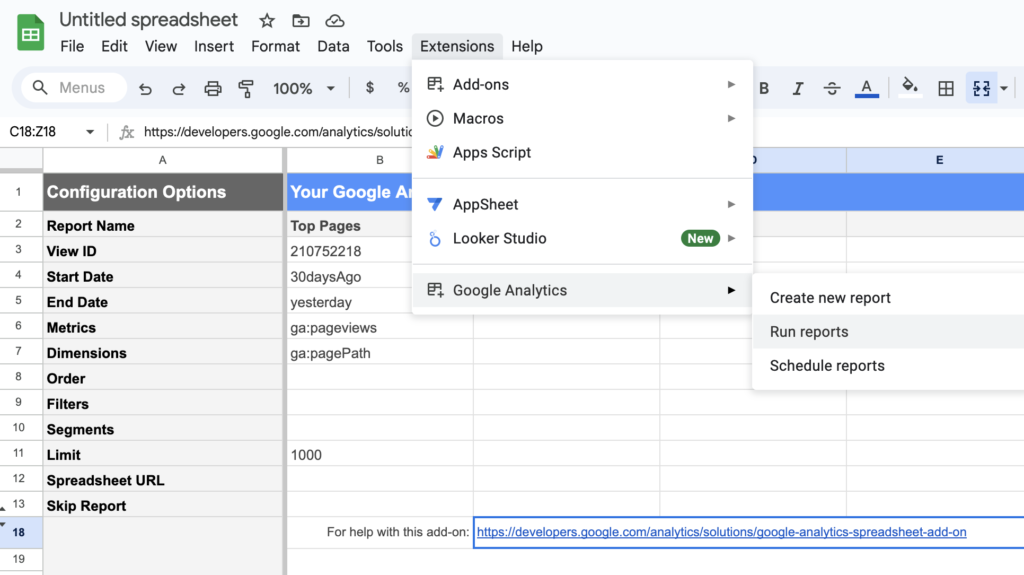
Step 2: You will now have the Google Analytics option under Extensions. Click Create new report.
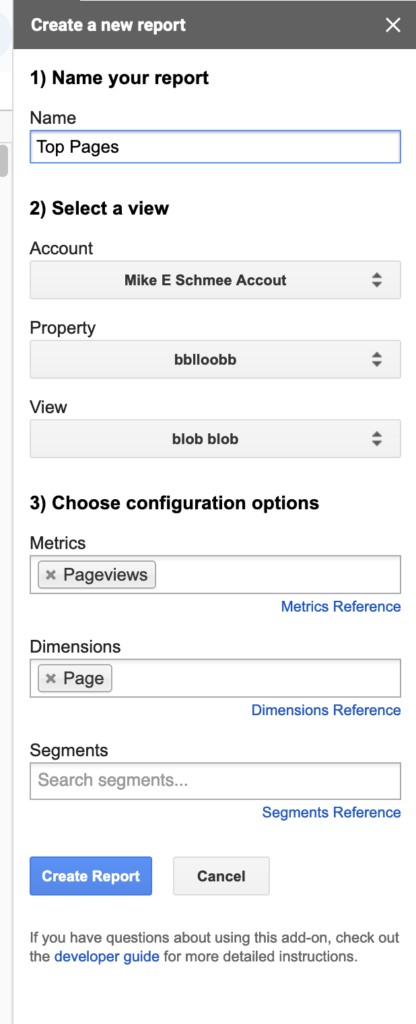
Step 3: Create your new report. Name it, select the correct View, the metrics and dimensions. Then click Create Report.
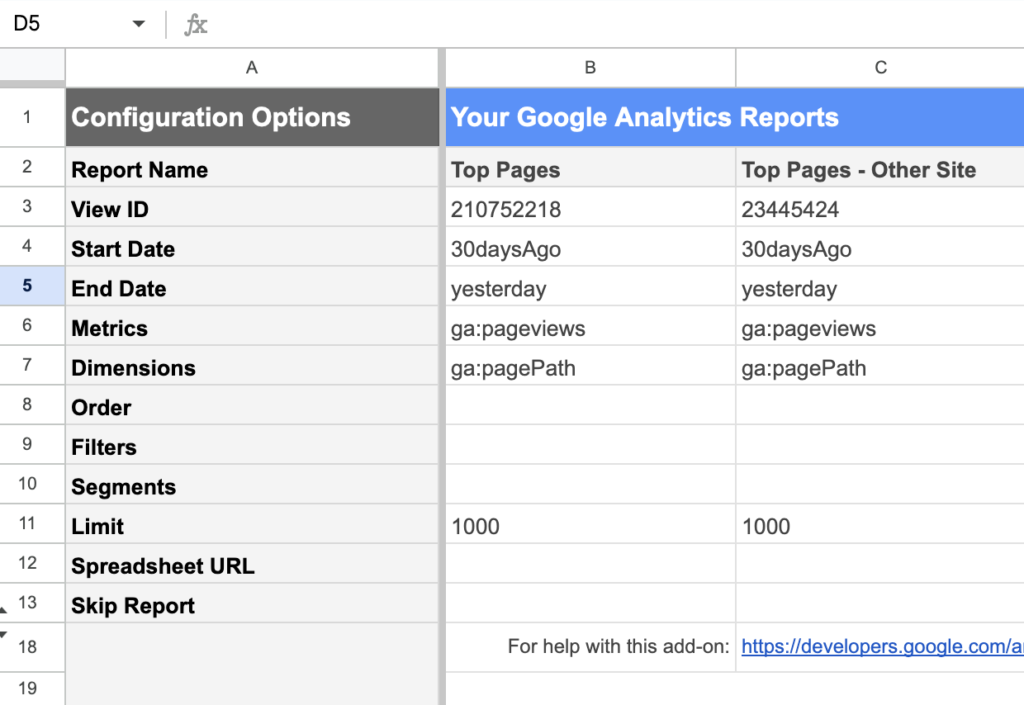
Step 4: This will create a new sheet, with the configuration options. These can be manually updated, including: Dates, Order, Filters, and Limits. You can also mass run the same report across many different views. Once you have it configured, copy and past everything under View ID, and then update rows 2 and 3 with that Views details.
I’ve found the Ordering specifically to be useful. If you wanted to see top pageviews for example, you’d use “-ga:pageviews” to show the top 1,000 pages by pageview. See full documentation here: https://developers.google.com/analytics/solutions/google-analytics-spreadsheet-add-on
Step 5: Run the report.
Step 6: View your reporting! Each column you have set in the configuration sheet, will be a separate sheet. I’ve run these up to like 75 different columns, and they can go sometimes slow, but as long as it’s not too large of a request, like 1,000 rows for each column, it should complete. I’ve had some with each report had 500 rows of data that stopped midway. If you then delete the columns that did finish, you can re-run the report and it will get the others.


And that’s it! I was happy to find this when I was trying to save some basic data for those 75 sites noted above, and this made it very quick.
Once I got the first one setup for all the sites, I was able to quickly edit the manual configuration with copy/paste of each new report I wanted. Thanks, bye!
Need help implementing, managing, understanding, or creating dashboards for website traffic data from Google Analytics? I have 13 years experience with Google Analytics, Google Tag Manager, and Google’s Looker Studio. Email me with questions or freelance opportunities. 🙂 mikeeschmee at gmail